
Xero Custom Reports: 5 Ways to Build Them in 2026
The definitive guide to get the exact report you need
If you've ever tried to create a custom report from Xero that doesn't look like it was designed by someone who hates finance professionals, you know the pain. The built-in reports are fine for basic stuff. But the moment your client or CEO asks for a board pack, a custom cash flow forecast, or a profitability report that actually matches how their business operates — you're either wrestling with Xero's layout editor or exporting to Excel and starting the copy-paste dance you've done a hundred times before.
This guide covers the main ways to get custom reports out of Xero in 2026, with honest assessments of what each method is actually good for.
The Four Approaches to Custom Xero Reports
There are really only four paths to build reports that have a different structure from the standard P&L on Xero:
- Xero's built-in report customization
- Export to Excel and build it yourself
- Build something with Xero's API (or use a BI tool that connects to it)
- Use a purpose-built reporting tool like Cheetah
Each has its place. Let's break them down honestly.
Option 1: Xero's Built-In Report Customization
Getting Started with the Layout Editor
Xero's customization lives in the Layout Editor, which you access from any report by clicking "Edit layout" in the bottom left corner.
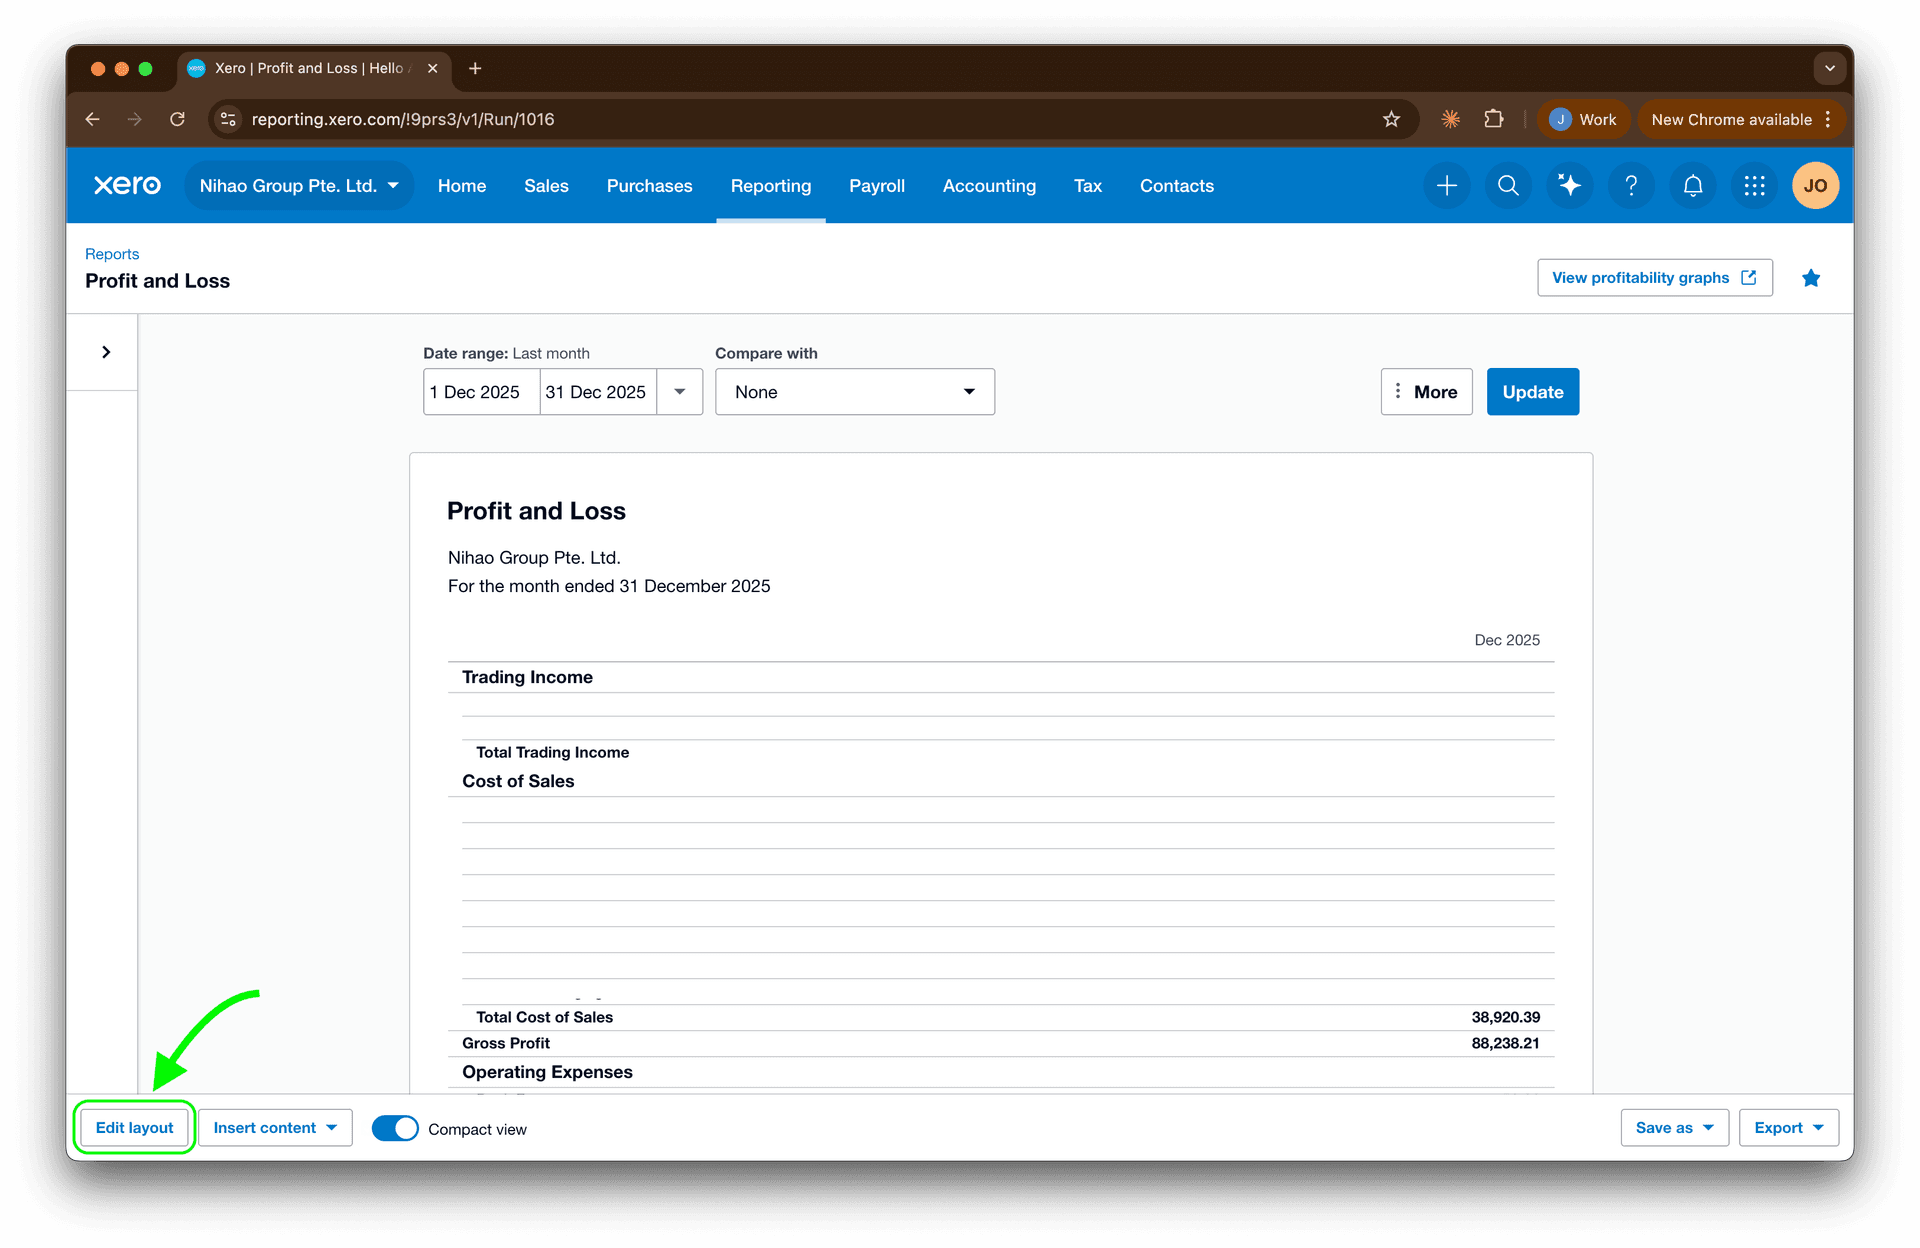
Once you're in the editor, you'll see your report broken into editable components. The interface is drag-and-drop, which makes rearranging things relatively intuitive.
What You Can Actually Do
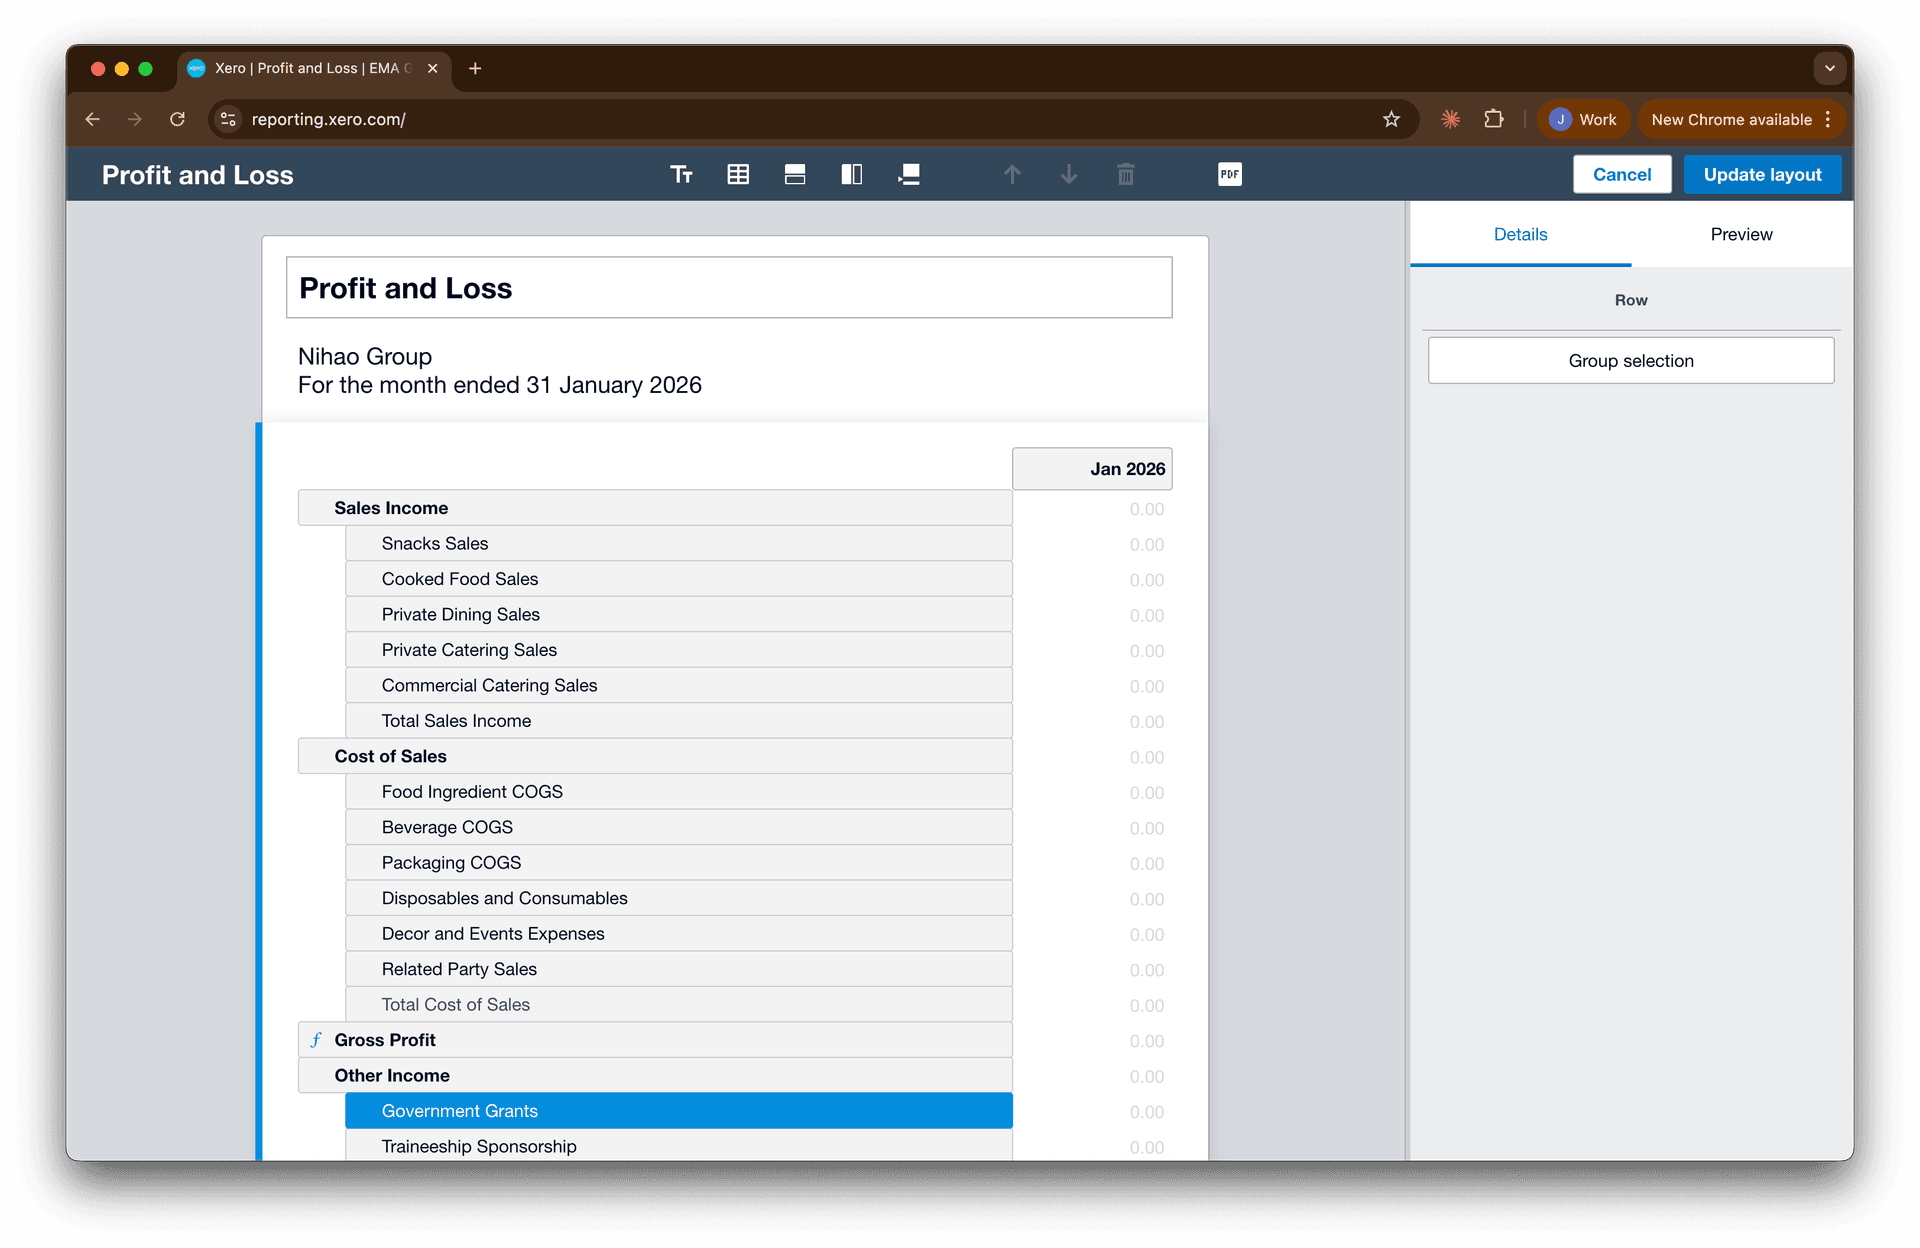
Create and edit account groups. You can move accounts between groups, create new groups, or collapse multiple accounts into a single line item. This is useful when Xero's default groupings don't match how you think about your chart of accounts.
For example, if you want to combine "Food Ingredient COGS" and "Beverage" within Cost of Goods Sold, you can create the sub-group "Raw Ingredient COGS" and drag the relevant accounts into it.
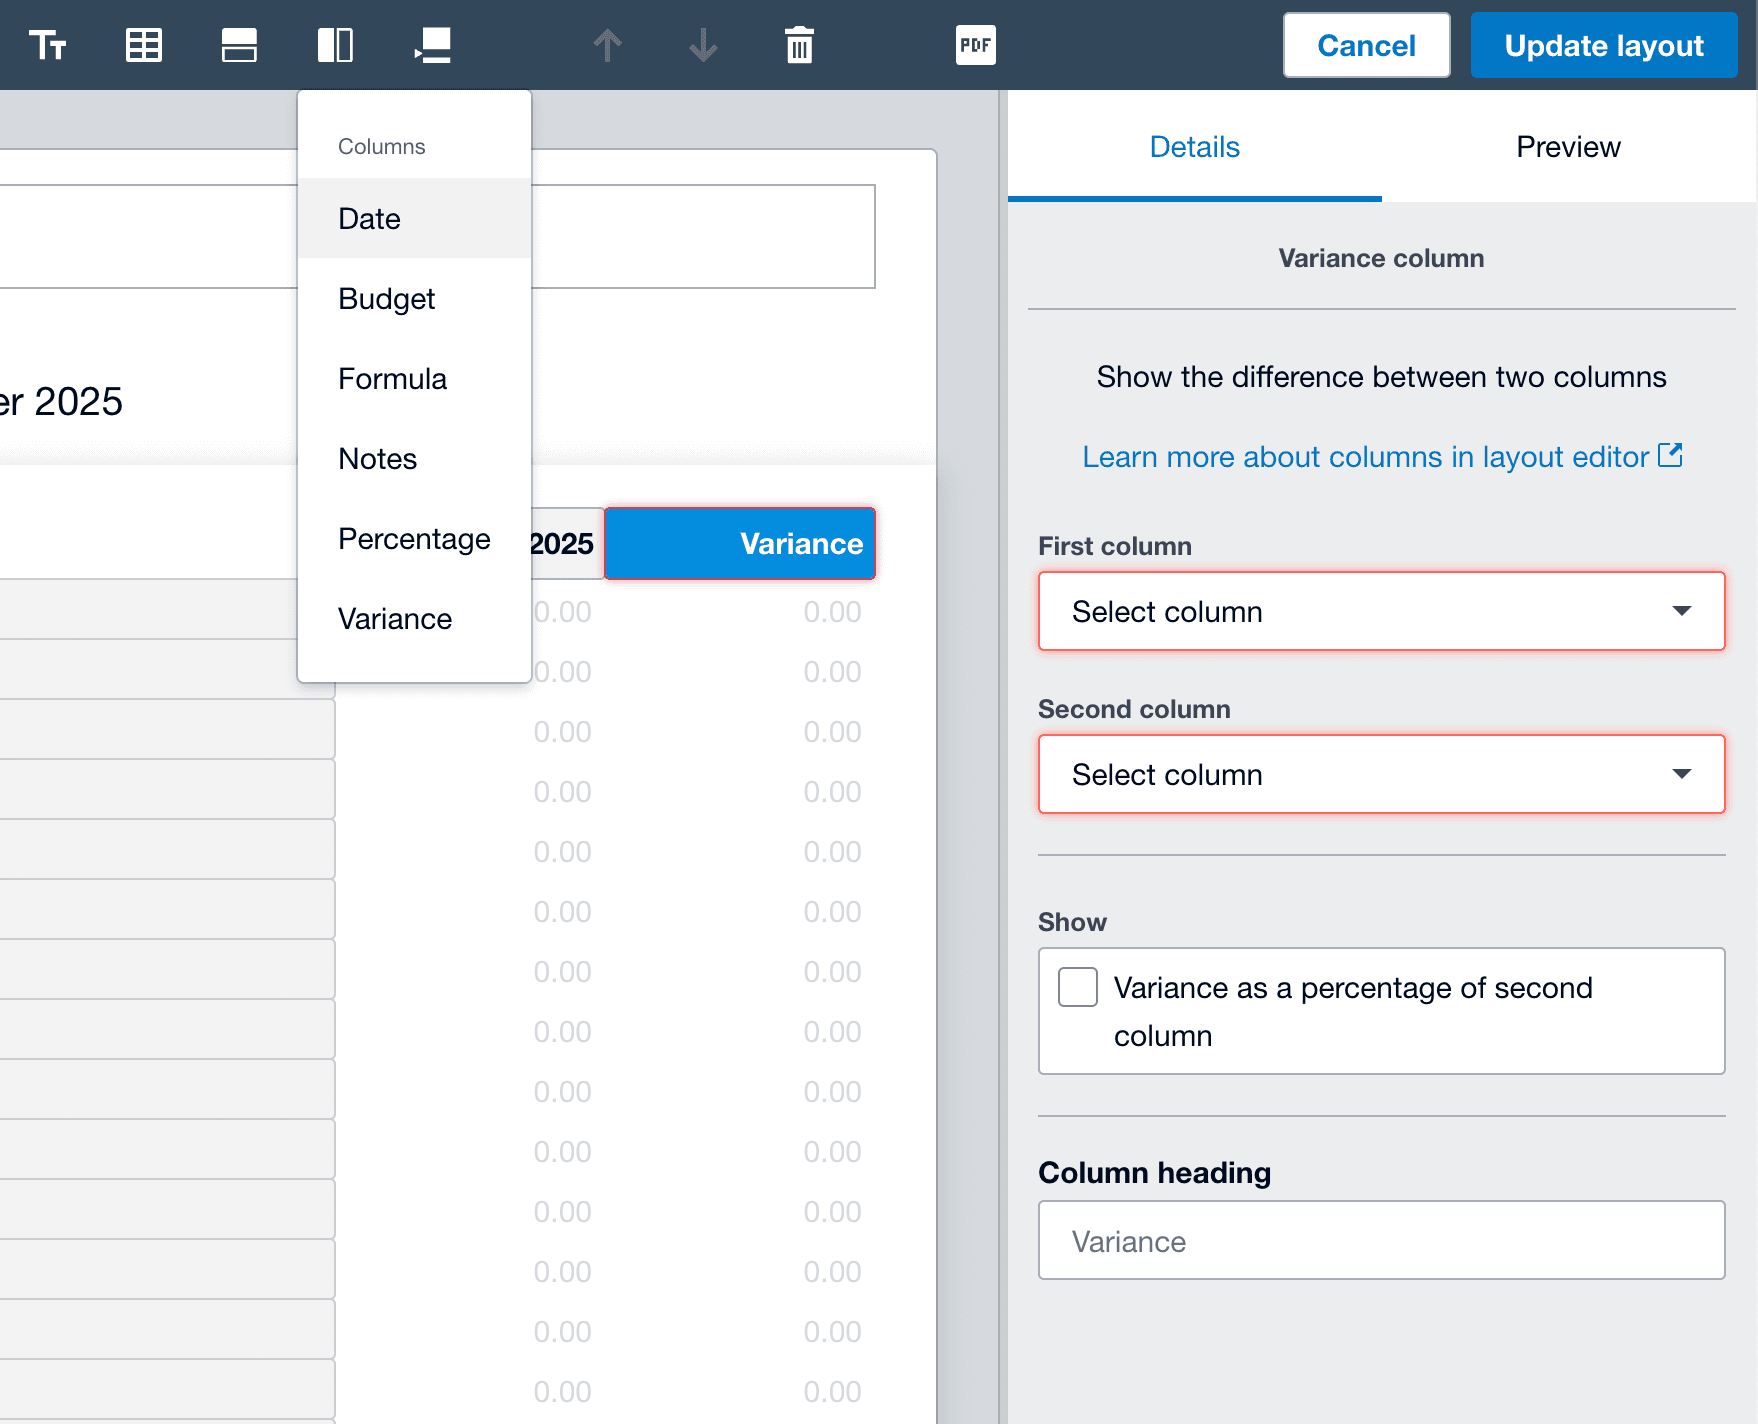
Add custom columns. The Layout Editor lets you add columns for:
- Additional date periods (prior month, prior year, year-to-date)
- Variance columns ($ and %)
- Budget columns (if you've set up budgets)
- Percentage of revenue calculations
You add columns from the toolbar, then drag them into your preferred order.
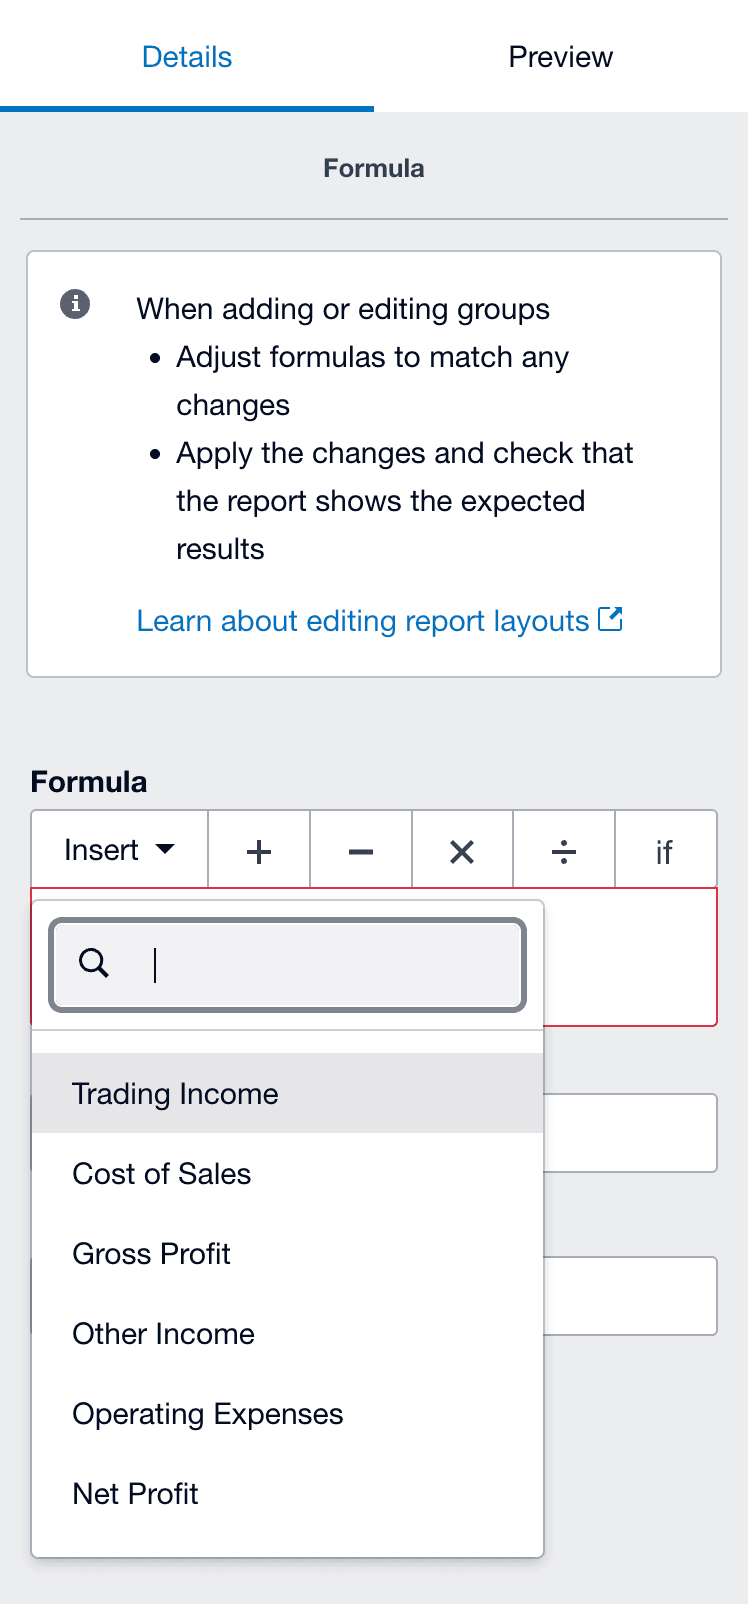
Write formulas. You can create calculated rows using Xero's formula syntax. Common uses include:
- Gross margin percentage
- Operating expense ratios
- Custom subtotals that pull from specific account groups
The formula editor is basic but functional. You reference account groups by name, which can break if you rename things later.
Add text blocks and notes. You can insert text at the top or bottom of reports, or add annotations to specific line items. Useful for management commentary or explaining unusual variances.
Save as a custom layout. Once you've made your changes, click "Save as" and select "Custom." Your layout will appear in the Custom tab of the Reports menu, available for anyone in the organization with reporting access.
Management Report Packs
Xero also offers Management Report Packs, which bundle multiple reports (P&L, Balance Sheet, Cash Flow, etc.) into a single deliverable with an executive summary and space for commentary.
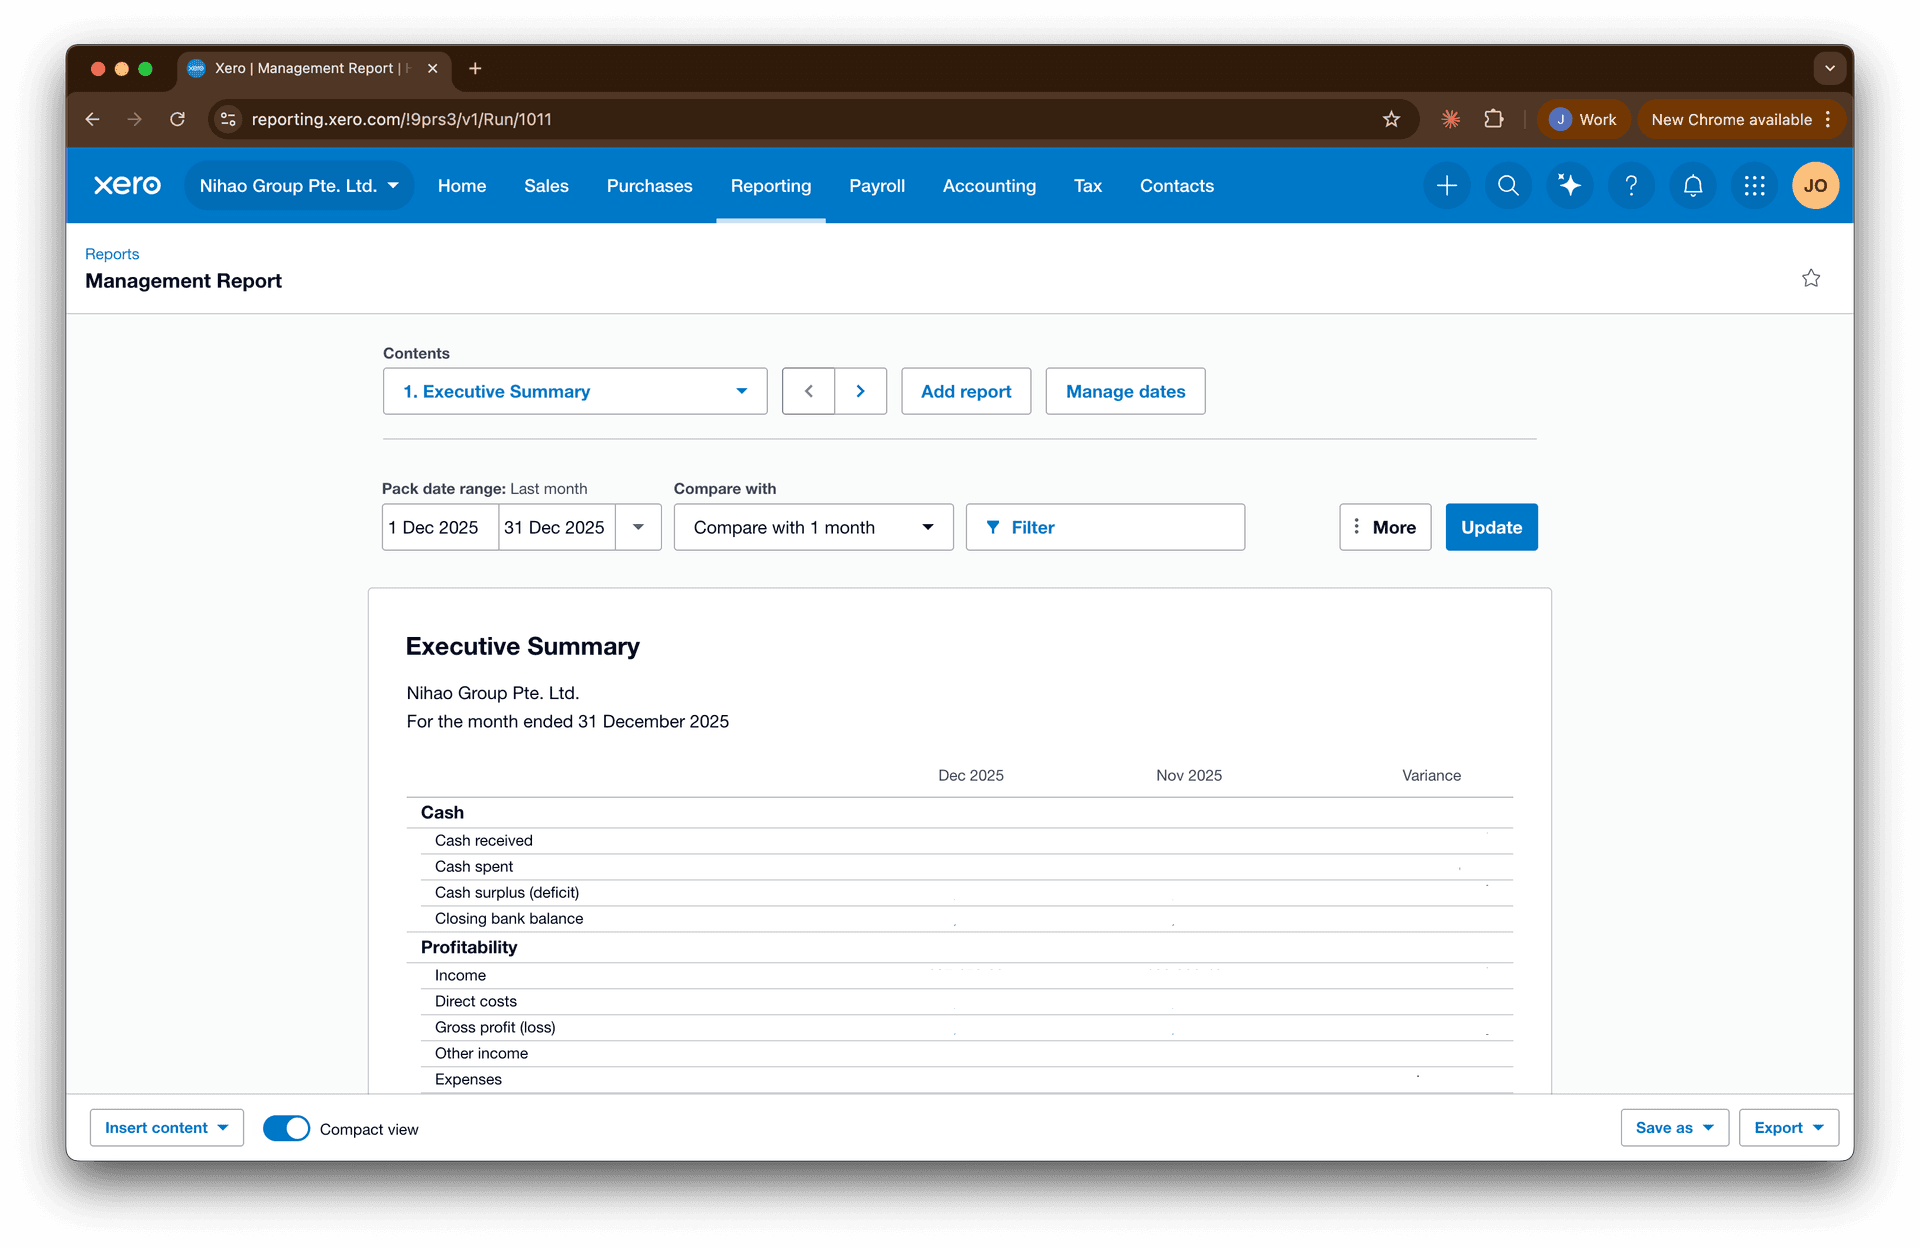
You can customize which reports are included, adjust the date ranges, and save the pack as a template. This is genuinely useful for recurring client deliverables — it beats exporting six separate PDFs and combining them manually.
For accounting firms, these packs are accessible through Xero HQ, which lets you apply templates across multiple client organizations (though you still need to generate each client's pack individually).
What You Can't Do
Here's where it gets frustrating:
You can't build a report from scratch. You're always starting from an existing template and modifying it. If Xero's base structure doesn't match what you need, you're limited to rearranging what's already there. There's no "blank canvas" option where you select exactly which data elements to include.
Multi-entity consolidation doesn't exist natively. If you manage multiple Xero organizations (which most accounting firms do), there's no built-in way to pull data across entities into a single view. You'd need to run the same report for each organization separately.
Tracking categories are limited. You can filter reports by a single tracking category, but you can't select multiple tracking categories simultaneously or create matrix-style reports that cross-reference two dimensions. If your client tracks by both Department and Region, you can't easily see a report broken down by both.
Performance degrades with complexity. Large datasets, multi-year periods, or complex calculations can slow reports significantly. Month-end with multiple users running reports simultaneously can be painful. Browser limitations compound this — running multiple reports in different tabs while your cache fills up doesn't help.
Budget integration doesn't work with custom layouts. This one's particularly frustrating. If you've spent time creating a custom P&L layout with specific groupings and subtotals, the Budget Manager won't respect that structure. You'll enter budgets in Xero's default format, then see variance reports that don't match your customized layout.
When Xero's Built-In Tools Make Sense
- Single-entity businesses with straightforward reporting needs
- Standard financial statements with minor tweaks (reordering accounts, adding a variance column)
- Quick ad-hoc reports where "good enough" is acceptable
- Management report packs for client deliverables where the standard formats work
- Situations where you'll run the report once or twice, not monthly
When They Don't
- Multi-entity reporting or consolidations
- Complex custom layouts that differ significantly from Xero's defaults
- Reports you need to produce repeatedly with minimal manual adjustment
- Dimensional analysis across multiple tracking categories
- Any scenario where your custom layout needs to integrate with budgeting
Verdict: Xero's native reporting has improved meaningfully over the years, and for single-entity businesses with standard needs, it can be sufficient. But the moment you need multi-entity views, complex structures, or tight budget integration, you'll hit limitations that no amount of Layout Editor finessing will solve.
Option 2: The Excel Export Workflow
This is the workhorse approach most finance professionals default to, and for good reason: Excel is familiar, flexible, and you control every cell. It also teaches you a tremendous lot if you're junior in your career looking to understand the nuts and bolts.
The Typical Workflow
- Export data from Xero (usually Trial Balance, transaction reports, or individual account details)
- Paste into your Excel template
- Rebuild formulas, fix formatting, adjust for this period's quirks
- Hope nothing breaks
- Repeat next month
The Problems
Xero's exports are designed for humans, not machines. The data comes out formatted for readability — merged cells, text headers, date formats that Excel interprets creatively. You'll spend time cleaning data before you can even start building.
It's manual. Every. Single. Time. Your cash flow forecast template is beautiful. But every month you're doing the same export-paste-adjust routine. Multiply that by the number of entities you manage.
Formula fragility. One accidental row insert, one account code change, and your carefully constructed report breaks. You might not even notice until someone asks why the numbers don't tie.
Multi-entity hell. Need to consolidate five companies? That's five exports, five paste operations, and a consolidation logic layer that you pray doesn't have errors.
Version control chaos. Which Excel file is the latest? Who made changes? Is this the one we sent to the board or the draft?
When Excel Makes Sense
- Truly one-off analysis that you'll never repeat
- Ad-hoc modeling where you need maximum flexibility
- Situations where the report structure changes significantly each time
- Small operations where you're only managing one or two entities
When It Doesn't
- Any report you produce monthly (or more frequently)
- Multi-entity environments
- Reports that need to be audit-proof and error-free
- Teams where multiple people touch the same reports
Verdict: Excel is powerful but expensive in time. The flexibility that makes it great for ad-hoc work makes it terrible for repeatable processes. If you're spending 6+ hours a week on report building, you're not doing finance work — you're doing data entry.
Option 3: The API Route (Building It Yourself or Using BI Tools)
For the technically inclined, Xero has an API. You can pull data programmatically and pipe it into Power BI, Tableau, a custom dashboard, or whatever visualization tool you prefer.
What This Gets You
- Real-time or near-real-time data
- Flexibility to structure data however you want
- Integration with other data sources
- Automation (once it's built)
The Reality Check
Xero's API has quirks. Date formats aren't consistent across endpoints. Pagination behaves differently depending on what you're pulling. Some data types have idiosyncratic structures that require special handling. Plan for more development time than you expect.
You need someone to build it. Unless you have in-house development resources, you're hiring someone. Custom BI solutions aren't cheap, and they require ongoing maintenance as Xero's API evolves.
The new API pricing model changes the math. Xero introduced tiered pricing for API access in December 2025. If you're an organisation with >5 entities or an accounting firm with multiple clients, you're looking at the Plus tier at minimum (US$25), plus ongoing maintenance and data pipeline operating cost.
When the API Route Makes Sense
- Large organizations with dedicated technical resources
- Situations where you need to blend Xero data with other sources (CRM, inventory systems, etc.)
- Enterprise-scale reporting with significant budgets
- Organizations already invested in a BI platform
If you decide this is for you, I've written a step-by-step guide on how you can build with Xero API.
When It Doesn't
- Small to mid-sized firms without development resources
- When the cost of building exceeds the cost of buying
- Organizations managing 6+ entities (API pricing makes third-party tools more economical)
- Teams that need something working this week, not this quarter
Verdict: The API route offers maximum flexibility but at significant cost in time, money, and ongoing maintenance. The new pricing model especially penalizes organizations in the "too big for free, too small for enterprise" middle ground.
Option 4: Purpose-Built Reporting Tools
This is where specialized tools like Cheetah fit in.
The Approach
You provide a reference report — the cash flow forecast format your board expects, the aged receivables layout your client loves, the P&L structure that matches how they actually think about their business.
The tool systematizes it: connects to your Xero data, maps the fields, applies the logic. From then on, you generate that report with live data whenever you need it.
What This Solves
No more export-paste-format cycles. The report pulls live data. Month-end closes, you click generate, you have your report.
Multi-entity without the pain. Need the same report across 10 companies? The logic is built once and applied everywhere.
Formulas don't break. The template is locked. The data flows in. The structure stays consistent.
Someone else deals with the infrastructure. Data pipelines, API quirks, security, scalability — these are real problems, but they're not your problems. Finance professionals shouldn't need to think about pagination logic or date format inconsistencies or what happens when Xero changes an endpoint. A good reporting tool handles all of that so you don't have to.
Time goes back to analysis. When you're not spending hours on mechanics, you can spend hours on actually understanding what the numbers mean. That's the real work.
Honest Limitations
Purpose-built tools work best when your report structure is stable. If you're constantly reinventing your report format, you're better off in Excel.
They also require some upfront effort to set up. You're not exporting and pasting anymore, but you are defining what you want once.
And they can only report on what's in Xero. If your report needs data from three different systems, you'll need a solution that can integrate multiple sources.
When Purpose-Built Tools Make Sense
- Repeatable reports you produce monthly or more frequently
- Multi-entity environments
- Finance teams that want to spend time on insights, not mechanics
- Organizations where report accuracy is non-negotiable
When They Don't
- Pure one-off analysis
- Reports that change structure constantly
- Situations where all your reporting needs are genuinely simple (single entity, standard financials)
The Three Reports Everyone Struggles With
Let's get specific. These are the reports that cause the most grief, and how each approach handles them.
Custom P&L Layouts
The problem: Your client's business doesn't think in Xero's default account structure. They want revenue broken out by product line, COGS that separates direct labor from materials, and operating expenses grouped by function not account code.
| Method | Feasibility |
|---|---|
| Xero native | You can modify the layout, but you're wrestling with account groups and hoping the structure holds. Budget integration won't match. |
| Excel | Workable, but you're rebuilding this every month. One account code change breaks your mapping. |
| API/BI tools | You can build exactly what you want, but you're writing transformation logic and maintaining it. |
| Purpose-built tools | Define the mapping once, generate forever. Changes to account codes can be handled systematically. |
Cash Flow Forecasts
The problem: You need a rolling forecast that shows where cash is heading — not just historical actuals, but projected inflows and outflows based on your outstanding receivables, payables coming due, and current cash position. Xero's cash flow report gives you actuals. The forecasting part is on you.
| Method | Feasibility |
|---|---|
| Xero native | Not really possible. You'll get a basic cash flow statement of what happened, not what's coming. |
| Excel | The default approach for most. Pull your AR aging to estimate inflows, AP aging for outflows, add your cash balance, and build out the weeks. Powerful but manual, and you're reconstructing this every time. |
| API/BI tools | Can be elegant — pull AR, AP, and bank balances programmatically and build a forecasting model. But requires significant build effort and maintenance. |
| Purpose-built tools | If the tool supports it, you define your forecast structure (timing assumptions for AR collection, payment schedules for AP), and it handles the data pulls and calculations against your current balances. |
Aged Receivables by Custom Segments
The problem: You don't just want aged receivables. You want it by customer segment, or region, or sales rep. Xero's default aging report doesn't slice that way.
| Method | Feasibility |
|---|---|
| Xero native | Limited. You can filter by tracking category, but not combine multiple dimensions. |
| Excel | Export, add your own lookup columns, build pivot tables. Every month. |
| API/BI tools | Pull the data, join with your customer segmentation table, build the view. Maintenance-heavy. |
| Purpose-built tools | Map your segments once, generate the report with the slicing you need. |
How to Decide
Here's a quick framework to make your decision:
Go with Xero's native tools if:
- You have one or two entities
- Your reporting needs align with Xero's default structures
- "Good enough" is genuinely good enough
Go with Excel if:
- It's truly a one-time analysis
- Your report structure changes constantly
- You enjoy spreadsheet work (no judgment)
Go with API/BI tools if:
- You have significant technical resources
- You need to integrate multiple data sources
- You're at enterprise scale with enterprise budgets
Go with purpose-built tools if:
- You're producing the same reports monthly
- You manage multiple entities
- Your time is better spent on analysis than mechanics
- You want reports that don't break
Where Cheetah Fits
We built Cheetah because we think finance professionals should spend their time on analysis, not on wrestling with data exports and broken formulas.
Here's how it works: You give us your reference report — the exact format you want, whether that's a cash flow forecast, custom P&L, aged receivables breakdown, or something else. We systematize it so that it pulls live data from your Xero organization(s). We handle the data infrastructure, the API connections, the security, and the edge cases. When you need the report, you generate it. Current data, your format, minimal manual work.
Interested? Get in touch — happy to show you how it works with your actual reports.

A finance professional turned product builder, Jarvin has built hundreds of reports by hand and knows what financial and operational reporting demands: customisability, auditability, scalability, and security. Having automated that work reliably, he's now helping advisory firms and finance teams do the same.